
- Case study · Home & Kitchen
Kitchenary: recovering margin a free-shipping promise was quietly eating
A US home and kitchen brand with strong national demand and flat profit. The growth problem turned out to be a logistics problem wearing a marketing costume — and fixing it lifted contribution margin 38% without losing volume.
INDUSTRY
MARKET
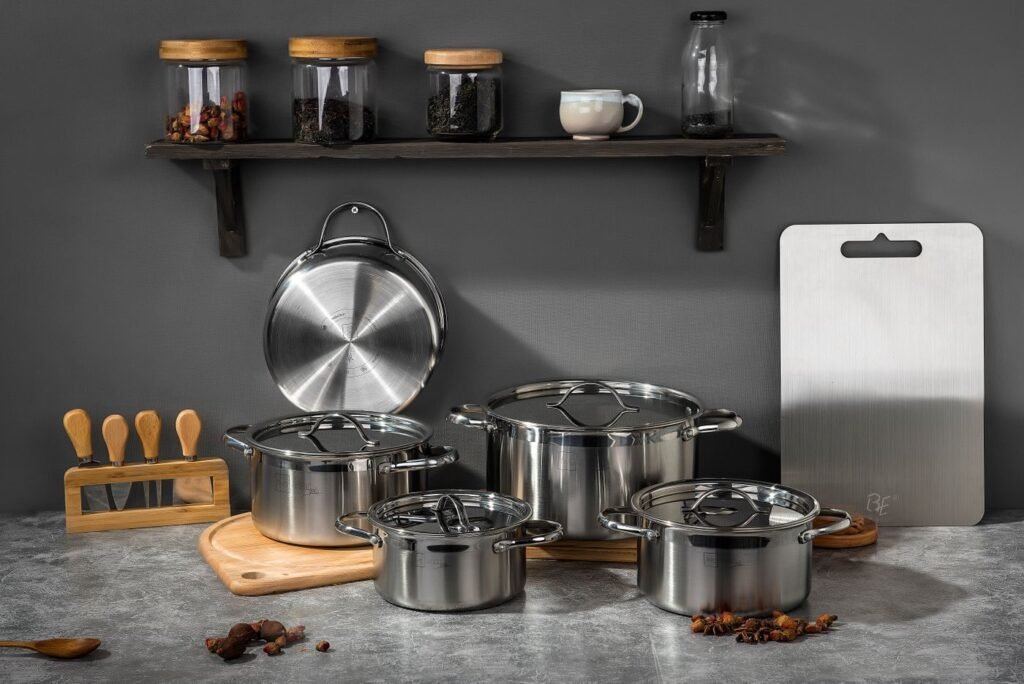
Kitchenary’s core cookware range — the products the ads pushed hardest, and the ones losing the most margin in transit.
- Results snapshot
What changed in two quarters
Volume held. The money that had been leaking into carriage came back to the bottom line.
+38%
Contribution margin
Blended, net of carriage and returns
-21%
Blended acquisition cost
Across paid search, shopping and social
+12%
Repeat purchase rate
Measured on a 90-day window
9 wks
To payback
On the engagement fee
Every figure below is measured against the same 90-day period a year earlier, not against the month before we started.
- About the client
A cookware brand that had outgrown its own setup
Kitchenary sells cookware and kitchen tools direct to consumers across the United States, with a second channel on Amazon.
Founded as a single-category cookware brand, Kitchenary had grown into a full kitchen range with several hundred SKUs and a healthy top line. Demand was not the problem — the brand ranked well, the ads worked, and the Amazon listings sold.
What had not kept up was the operating model underneath. The pricing, shipping and channel decisions had all been made when the range was small and light. By the time we were brought in, the catalogue included bulky cast iron and multi-piece sets moving on rules written for saucepans.
- Direct-to-consumer storefront on Shopify, plus an Amazon US channel
- Several hundred SKUs spanning light tools and heavy cookware
- National shipping with a single free-delivery threshold
- In-house marketing team of three, no dedicated analyst

- The challenge
Revenue was growing and profit was not
The brief we were given was “scale paid media”. The numbers said the opposite was needed first.

Kitchenary offered free delivery nationwide above a single order value, set years earlier. That threshold made sense for a saucepan and no sense at all for a twelve-piece set going to a far zone. The heaviest products were also the ones the ads promoted hardest, because they had the highest order values — so paid spend was actively buying the least profitable orders.
On top of that, the Amazon listings were priced independently of the owned store. In several categories the brand was undercutting its own margin channel and paying a marketplace fee for the privilege.
- One national free-shipping threshold applied to every weight and every zone
- Paid budget concentrated on the heaviest, least profitable SKUs
- Amazon pricing set independently, undercutting the owned store
- Reporting on revenue and ROAS, with carriage sitting outside the numbers
- Our analysis
Where the money was actually going
Two weeks of work on the data before a single recommendation was written.
We rebuilt the P&L per order rather than per channel. Once carriage, packaging, returns and marketplace fees were pulled into the same view, the picture inverted: the campaigns with the best reported ROAS were the ones losing money, and two mid-value ranges nobody was promoting were carrying the business.
Splitting the same data by shipping zone made the second problem obvious. Orders travelling more than two zones cost roughly three times as much to deliver, and represented almost a third of volume.
- Contribution margin rebuilt per order, per SKU and per zone
- Two profitable ranges found with almost no media support behind them
- Roughly a third of orders travelling far enough to triple carriage cost
- Amazon and owned-store pricing compared line by line for the first time

The analysis changed the brief. Scaling media came later; it would have amplified the leak.
- Strategy
Fix the economics, then buy growth
Three commitments, agreed before any work started, in the order they had to happen.
Make every order carry its own cost
- Shipping thresholds set by zone and product weight
- Carriage and returns moved inside the reporting
- Loss-making SKU and zone combinations priced or dropped
Point the media at what actually pays
- Budget re-weighted toward the two under-supported ranges
- Geo-modified bidding aligned to delivery economics
- Targets set on contribution margin rather than ROAS
Stop the channels competing
- One pricing policy governing Shopify and Amazon together
- Range split so each channel leads on what it is best at
- Buy-box health managed rather than left to the repricer
Nothing here required new tooling. It required the numbers to be assembled in one place and then acted on.
- What we did
The work, service by service
Four service lines, one team, one shared plan. Each links through to how we run that service generally.
MANAGEMENT
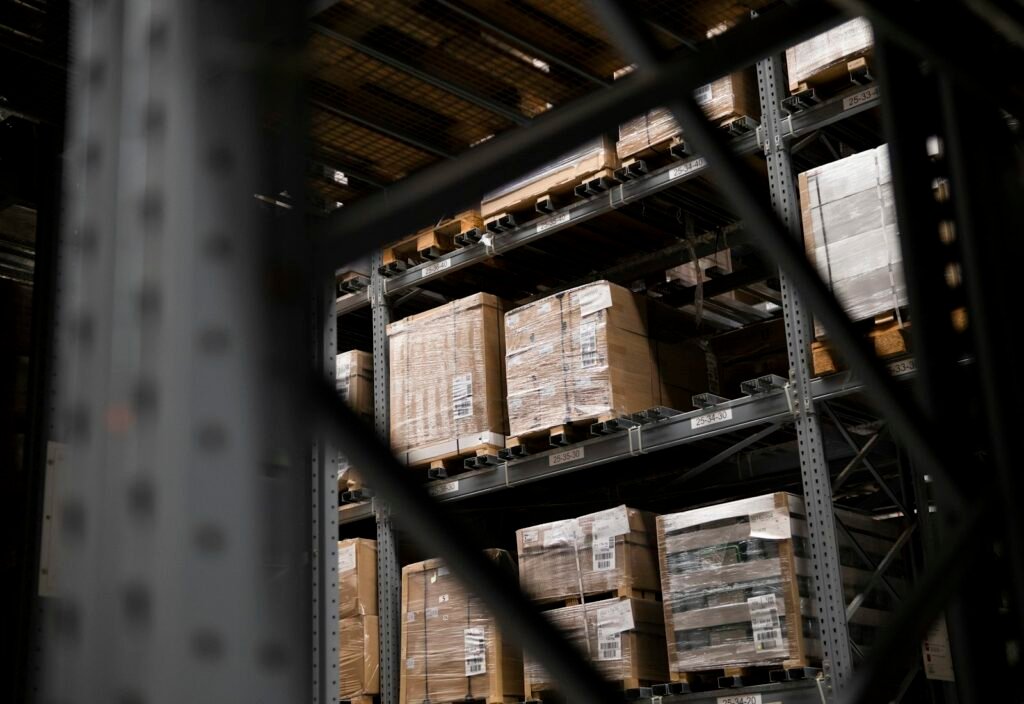
Zone and weight-based thresholds replaced the flat national rule, carrier mix was matched to the real order profile, and every SKU was re-checked against its landed cost.
- Five shipping zones with weight bands, replacing one flat rule
- Carrier mix re-tendered against the actual parcel profile
- Catalogue-wide landed cost review

PAID MEDIA
Campaign structure rebuilt around contribution margin, with geo-modifiers reflecting what delivery actually costs in each region.
- Campaigns restructured by margin tier rather than by category
- Geo bid modifiers aligned to shipping zones
- Two under-promoted ranges given their own budget
CONVERSION
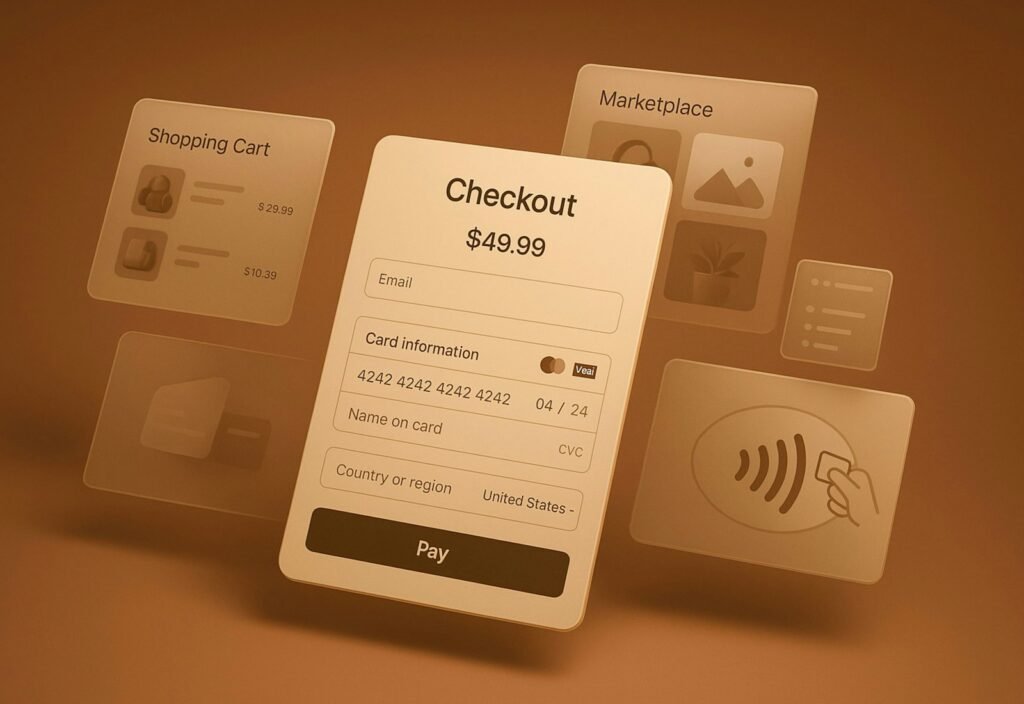
Raising a shipping threshold usually costs conversion. Presenting it properly — early, specifically and with the reason visible — meant it did not.
- Delivery estimate surfaced on the product page, not the cart
- Threshold progress shown in the basket
- Returns terms rewritten in plain language

MARKETPLACE
One pricing policy across both channels, a cleaned-up catalogue and active buy-box management instead of an unattended repricer.
- Single pricing policy governing both channels
- Variation and parent-child structure rebuilt
- Buy-box share monitored and defended weekly
- Implementation
How it was sequenced
Sixteen weeks, ordered so the fastest margin recovery landed first and nothing shipped before the reporting could see it.
WEEKS 1-3
Instrument first
Rebuilt reporting so carriage, returns and marketplace fees sat inside contribution margin. Nothing was changed on the site until the baseline was trustworthy.
WEEKS 4-7
Shipping and pricing
Zone and weight thresholds went live alongside the product-page delivery messaging, so the commercial change and the conversion work landed together.
WEEKS 8-12
Media re-weighting
Campaign restructure rolled out range by range, holding the previous structure alongside it long enough to compare like for like.
WEEKS 13-16
Marketplace alignment
Pricing policy applied across both channels, catalogue structure rebuilt, and buy-box monitoring handed to a weekly rhythm.
The shipping change was the one everyone was nervous about. Sequencing it with the conversion work is why it did not cost volume.
- Results
The KPI breakdown
Measured over 90 days, against the same period a year earlier.
Metric
Before
After
Change
Contribution margin (blended)
18.4%
25.4%
+38%
Blended acquisition cost
$41.20
$32.55
-21%
Repeat purchase rate (90-day)
14.8%
16.6%
+12%
Average order value
$86
$94
+9%
Shipping cost per order
$11.90
$8.40
-29%
Amazon buy-box share
61%
78%
+17pt
Revenue
baseline
held
flat
Revenue deliberately held flat during the transition. The goal was to keep volume while the economics were repaired, not to trade one for the other.
- Supporting evidence
Before and after, side by side
The operating changes that produced the numbers above.
BEFORE
• One free-shipping threshold applied to every postcode and every weight
• Reporting on revenue and ROAS, with carriage outside the numbers
• Paid budget concentrated on the heaviest, lowest-margin ranges
• Amazon repricer running unattended against the owned store
• Delivery estimate first shown at the checkout step
AFTER
• Five shipping zones with weight bands, each carrying its own cost
• Contribution margin reported per order, per SKU and per zone
• Budget re-weighted to the two ranges that actually pay
• One pricing policy governing Shopify and Amazon together
• Delivery estimate surfaced on the product page, before the basket

The single highest-value change was the least glamorous one: putting carriage inside the margin number so the rest of the decisions could be made honestly.
- Why it worked
Why this strategy worked and a cheaper one would not
Four mechanisms did the work here. None of them was a new channel, and none of them needed more budget.
We changed the number everyone optimised to
Carriage went inside the margin calculation before anything else was touched. Once contribution margin was reported per order, per SKU and per zone, every decision that followed — which ranges to push, where to set thresholds, what to bid — was made against the real economics rather than against revenue.
The fix sat where the cost was created
The loss was manufactured in carriage, by weight and by distance, not in the ad account. Five zones with weight bands addressed the cause directly, which is why the gain held instead of eroding the following quarter.
Both channels were governed by one policy
The store and the marketplace had been undercutting each other through an unattended repricer. One pricing policy across Shopify and Amazon stopped the brand competing with itself, which recovered price without surrendering the buy box.
The customer learned the terms early
Moving the delivery estimate to the product page meant a higher free-shipping threshold was understood before the basket. The threshold rose and conversion held, because nobody met the cost for the first time at checkout.
WHAT WOULD NOT HAVE WORKED
The original brief was to lower cost per acquisition, and doing that would have made the reporting look better while the business got worse: a cheaper click on an order that loses money in transit still loses money. Equally, raising the free-shipping threshold on its own — the obvious move — would have cost volume, because at that point nothing in the journey prepared the customer for it.
We came in asking for more traffic. What we needed was someone willing to tell us the traffic we already had was losing money.
Head of eCommerce
Kitchenary
Read Priya Raghavan’s full review of this engagement — why they went looking for an agency, what they had already tried, and what they would change.
- Services used
The service lines behind this engagement
Four of our nine service lines worked on this account, under a single plan and a single owner. Each links to how that service is run generally.
Catalogue, pricing, the shipping model and channel health — the service that owned the change that mattered most here.
Paid search, shopping and social, restructured to buy contribution margin rather than revenue.
Product page, basket and checkout work that let a higher shipping threshold land without costing conversion.
Listing quality, one pricing policy across both channels, and buy-box health managed weekly.
- Classification
Platform, industry and market
Every case study on this site is classified on four axes so you can find the one that matches your situation rather than the one we happened to feature.
This engagement is filed as eCommerce Management + Shopify + Home & Furniture + USA. It appears on each of those four pages.
- Related work
Other case studies worth reading
Matched on shared services, platform or market.



Is your paid media buying orders that lose money?
Most brands cannot answer that, because carriage and returns sit outside the reporting. Tell us what you sell and how you ship it, and we will tell you what your real contribution margin looks like.