
- Case study · Fashion & Apparel
Lumen Atelier: when the paid account was fine and the creative was the constraint
A US apparel brand whose paid performance had been declining for three quarters. The account structure was competent, the bids were sensible, and none of that was the problem.
PLATFORM
INDUSTRY
MARKET
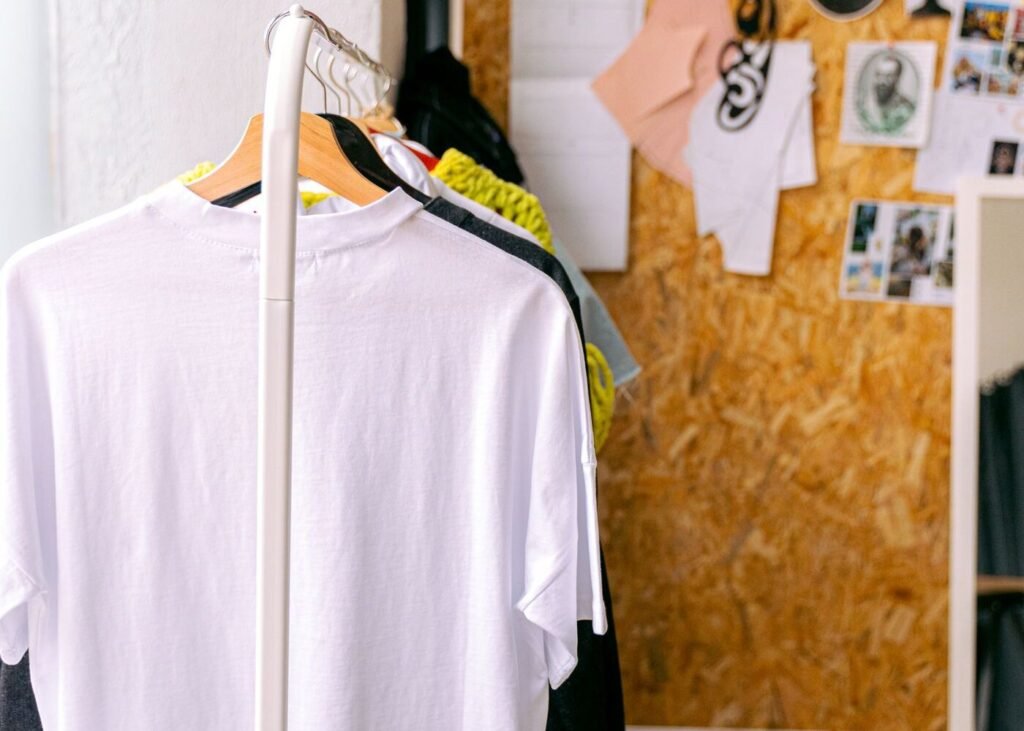
Lumen Atelier’s seasonal range — four collections a year, and a creative pipeline built for one.
- Results snapshot
What changed in two quarters
The account structure barely moved. What changed was how much creative reached it, and what the bids were optimising toward.
-31%
Cost per acquisition
Blended across paid search and social
+24%
New customer revenue
First-time buyers, not repeat
-9pt
Return rate
On the ranges driving most returns
6 wks
To payback
On the engagement fee
Cost per acquisition here is net of returns. On a fashion account, a gross figure flatters every campaign that sells the wrong size.
- About the client
A seasonal apparel brand on Shopify
Lumen Atelier sells womenswear direct to consumers across the United States, releasing four collections a year.
Lumen Atelier had grown quickly on the strength of a distinctive design point of view and a founder with a genuine audience. Paid social did most of the acquisition work, and for two years it did it cheaply.
The brand had scaled its product operation to four collections a year without scaling anything else. Creative was still produced the way it had been at launch: one shoot per season, a handful of assets, and whatever the founder posted organically.
- Shopify storefront, direct to consumer only
- Four collections a year across roughly 120 active SKUs
- Paid social carrying the majority of new customer acquisition
- One seasonal shoot supplying a full quarter of advertising
- The challenge
Performance decaying on a well-run account
Three quarters of steady decline, and an account that looked fine under audit.

The agency before us had done sensible work. Campaign structure was clean, audiences were reasonable, bidding was appropriate. Performance had still fallen every quarter, and the obvious levers had all been pulled.
Underneath that, returns were quietly making the numbers worse than they read. The brand reported on gross revenue, so campaigns selling the ranges with the highest return rate looked like the best performers — and got more budget for it.
- A creative library refreshed quarterly against a channel that consumes weekly
- Frequency climbing steadily on every core audience
- Reporting on gross revenue, with returns outside the numbers
- Budget flowing toward the ranges with the worst return rate
- Our analysis
A creative supply problem, not a media problem
The account was healthy. The thing feeding it was not.
Plotting performance against creative age made the pattern unmistakable. Every asset decayed on roughly the same curve: strong for eleven to fourteen days, then a steady fall. With one shoot per quarter, the account spent most of its life running assets past the point where they worked.
Recalculating performance net of returns reordered the account completely. Two ranges that looked like the best performers on gross revenue were among the worst once returns were counted, and a mid-price range nobody had prioritised was the most profitable thing the brand sold.
- Creative decaying predictably after eleven to fourteen days
- Roughly seventy per cent of spend running on assets past that window
- Return rates varying by more than twenty points between ranges
- The most profitable range receiving the least budget

No bid strategy recovers a channel that has run out of things to say.
- Strategy
Feed the channel, then aim it properly
Three commitments, in the order they had to happen.
Build a production rhythm, not a shoot
- Creative output measured weekly rather than seasonally
- A repeatable format set instead of bespoke concepts
- Retirement rules so tired assets stop spending
Optimise to margin after returns
- Returns pulled into the performance reporting
- Budget re-weighted to profit rather than gross revenue
- Return rate treated as a campaign metric
Reduce the returns at source
- Fit guidance rebuilt on the product page
- Model measurements and garment detail made consistent
- Size confidence improved before the order, not after
The creative fix raised volume. The returns fix is what made that volume worth having.
- What we did
The work, service by service
Four service lines, one team, one shared plan.

CREATIVE
A defined format set — product-in-use, detail, styling, founder-led and user-generated — produced continuously rather than commissioned per season.
- A repeatable format set replacing bespoke concepts
- Weekly production instead of one seasonal shoot
- Retirement rules applied at fourteen days

PAID MEDIA
Return rates fed back into the campaign structure, so budget followed contribution rather than the ranges that merely sold well before refunds.
- Returns data fed into campaign reporting
- Budget re-weighted by range profitability
- Testing budget ring-fenced for new creative

CONVERSION
Most returns were fit-related. Consistent measurements, model context and honest sizing guidance did more for margin than any bid change could.
- Garment measurements standardised across the catalogue
- Model height and size stated on every product
- Fit guidance tested and iterated on the highest-return ranges

MARKETING
Launch, sustain and clearance phases given their own creative and budget plans, so each collection was supported through its whole life rather than only at launch.
- Launch, sustain and clearance planned per collection
- Organic and paid working from one content calendar
- Clearance planned before the season, not in reaction to it
- Implementation
How it was sequenced
Twelve weeks, ordered so creative supply was solved before the media plan depended on it.
WEEKS 1-2
Rebuild the numbers
Returns pulled into performance reporting by range and by campaign. The account leaderboard changed before anything else did.
WEEKS 3-5
Stand up production
Format set defined and the first four weeks of assets produced before any campaign change, so the new structure had something to run.
WEEKS 6-9
Restructure the media
Campaigns rebuilt around margin tiers, with ring-fenced testing budget and automatic retirement of tired assets.
WEEKS 10-12
Fix returns at source
Product page fit work rolled out on the highest-return ranges first, then extended across the catalogue.
Building four weeks of creative before touching the campaigns felt slow. It is the reason the restructure did not stall in week seven.
- Results
The KPI breakdown
Measured over 90 days, against the same period a year earlier.
Metric
Before
After
Change
Cost per acquisition (net of returns)
$68
$47
-31%
New customer revenue
baseline
+24%
+24%
Return rate (highest ranges)
38%
29%
-9pt
Creative assets live per month
9
34
+278%
Average creative age in market
46 days
13 days
-72%
Frequency on core audiences
4.8
2.6
-46%
Contribution margin per order
$21
$34
+62%
Creative volume is the input, not the result. It is listed here because it is the variable that moved everything else.
- Supporting evidence
Before and after, side by side
The operating changes behind the numbers above.
BEFORE
• One seasonal shoot supplying a full quarter of advertising
• Roughly seventy per cent of spend on creative past its effective window
• Performance reported on gross revenue, returns excluded
• Budget flowing to the ranges with the worst return rate
• Sizing guidance inconsistent across the catalogue
AFTER
• A weekly production rhythm against a defined format set
• Automatic retirement of assets at fourteen days
• Performance reported net of returns, by range and campaign
• Budget re-weighted to contribution margin per order
• Standardised measurements and model context on every product

Nothing here required a bigger media budget. The same spend simply stopped running against assets the audience had already seen.
- Why it worked
Why the answer was not in the ad account
The media was already well run. What changed was what fed it, and what it was pointed at.
Creative became a supply line, not an event
Assets decayed on a consistent curve: strong for eleven to fourteen days, then falling. One shoot per quarter meant the account spent most of its life running creative past the point where it worked. A weekly production rhythm kept assets inside their effective window.
Budget followed margin after returns
Reporting on gross revenue had been sending spend to the ranges with the highest return rate, because they looked like the best performers. Recalculating net of returns reordered the account and moved budget to a mid-price range nobody had prioritised.
Returns were attacked at the source
Most returns were fit-related, which is a product page problem rather than a logistics one. Consistent measurements, model context and honest sizing guidance did more for contribution margin than any bid adjustment could have.
WHAT WOULD NOT HAVE WORKED
Another restructure of the account, which is where this normally goes. The previous agency had already built a clean structure with reasonable audiences and appropriate bidding, and performance still fell every quarter. No bid strategy recovers an asset that has aged out of its window, and no audience change fixes budget being pointed at the ranges customers send back.
Three agencies had told us the account needed restructuring. The account was fine. We were asking it to sell four collections a year with one shoot behind it.
Head of Growth
Lumen Atelier
Read Violet Hina’s full review of this engagement — why they went looking for an agency, what they had already tried, and what they would change.
- Services used
The service lines behind this engagement
Four of our nine service lines worked on this account, under a single plan and a single owner.
Campaign structure, bidding and budget allocation, rebuilt around margin after returns.
The production rhythm that replaced the seasonal shoot — the change that mattered most here.
Fit guidance and product page work that cut returns at source rather than after the fact.
A trading calendar covering each collection from launch through clearance.
- Classification
Platform, industry and market
Every case study on this site is classified on four axes so you can find the one that matches your situation.
This engagement is filed as PPC + Shopify + Fashion & Apparel + USA. It appears on each of those four pages.
- Related work
Other case studies worth reading
Matched on shared services, platform or market.


Is your paid account underperforming, or under-supplied?
On most apparel accounts we audit, the media is competent and the creative pipeline is the bottleneck. Tell us how often you produce, and we will tell you which one you have.